Skip to content ↓
Menu
Close
Subscribe
Search
Translate
Home
Reception Open Evening
Information
Intent
Equality
Prospectus
Admissions
Attendance
Organisation
The Staff Team
Governors
Stakeholders
Policies
School History
British Values
Pupil Premium
PE and Sports
Safeguarding Children at Southfields
Special Educational Needs and Disabilities
Financial Information
The Sunshine Nurture Room
School Performance Measures
Learning
Our Curriculum
Phases
Performance Data
Environment
Home Learning
Pupil Voice
Greater Depth and Rapid Grasper
Extended School
Assessment at Southfields
Oracy - Voice 21 Centre of Excellence
Parents
New Reception Intake September 2025
Term Dates 2024 - 2027
The School Day
Uniform
School Meals
Explorers Breakfast and After School Club
Parent Support
Parent View
Community Matters
New to School
Ofsted Report
School Nursing
Latest News
School News
School Calendar
Safer Schools Newsletters - moved to dojo
Children's University
Headteacher Newsletters
Letters moved to DoJo
Vacancies
Reception Open Evening
Contact Us
General Contact
Special Needs and/or Disability Contact
Inclusion Contact
Attendance Contact
Headteacher Contact
Explorer Club
Governor Contact
Medical, EVC, Placements and Volunteering
Welcome to our school friends from Ukraine
FAQ
Online Forms
Speech and Language Hub
For Parents - Resources and Support
For professionals - Resources and support
Speech, Language and Communication - Find out more
Supporting Local Schools 0-18
Quicklinks
Term Dates
Parent Pay - book meals and pay for trips/music
Virtual Tour
Prospectus
What's going on?
Southfields Learning Environment
Parentview
Southfields
Primary School
Home
»
Learning
»
Performance Data
»
In this section
Our Curriculum
Phases
Performance Data
Environment
Home Learning
Pupil Voice
Greater Depth and Rapid Grasper
Extended School
Assessment at Southfields
Oracy - Voice 21 Centre of Excellence
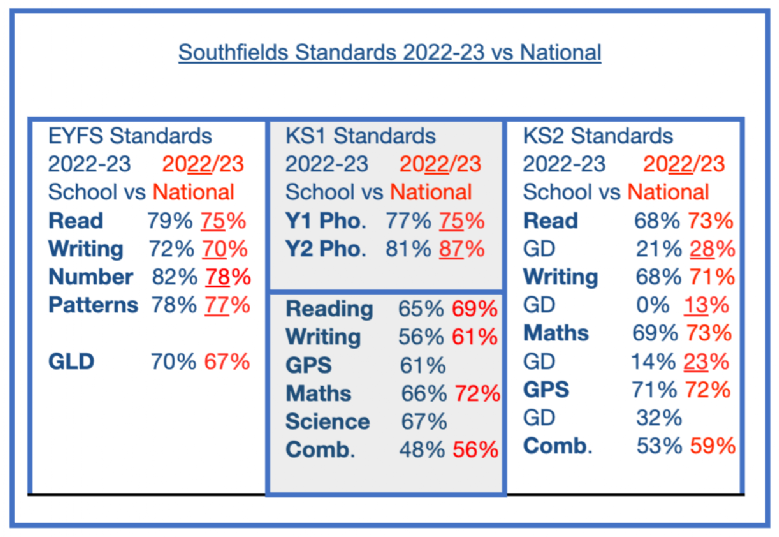
Performance Data
The DFE publish Primary School Performance Tables each year. We invite you to access the Primary School League Tables at
www.education.gov.uk/schools/performance/index.html
.